目的
为什么要做日志分析平台?
随着业务量的增长,每天业务服务器将会产生上亿条的日志,单个日志文件达几个GB,这时我们发现用Linux自带工具,cat grep awk 分析越来越力不从心了,而且除了服务器日志,还有程序报错日志,分布在不同的服务器,查阅繁琐。
待解决的痛点:
1、大量不同种类的日志成为了运维人员的负担,不方便管理;
2、单个日志文件巨大,无法使用常用的文本工具分析,检索困难;
3、日志分布在多台不同的服务器上,业务一旦出现故障,需要一台台查看日志。
为了解决以上困扰: 接下来我们要一步步构建这个日志分析平台,架构图如下:
架构图的构建考虑:
1,考虑既能收集日志,又是轻量级的,所耗服务器资源和负载较低。选用filebeat
2, 考虑到高可用和日志数据的安全,加入缓存中间件集群。选用kafka和zookeeper
3, 在kafka集群前面加入logstash进行导入,是为了横向扩展kafka的broker。试想下,添加或减少kafka broker集群节点,需要每台机器上更改filebeat的配置,那就头疼了。
4,在kafka集群后面添加logstash转发层,是为了可以根据kafka集群topic的使用情况横向扩展,负载较高的topic可以适当增加logstash进行处理。
5,es集群负责存储,kibana前端展示和搜索。
架构图:
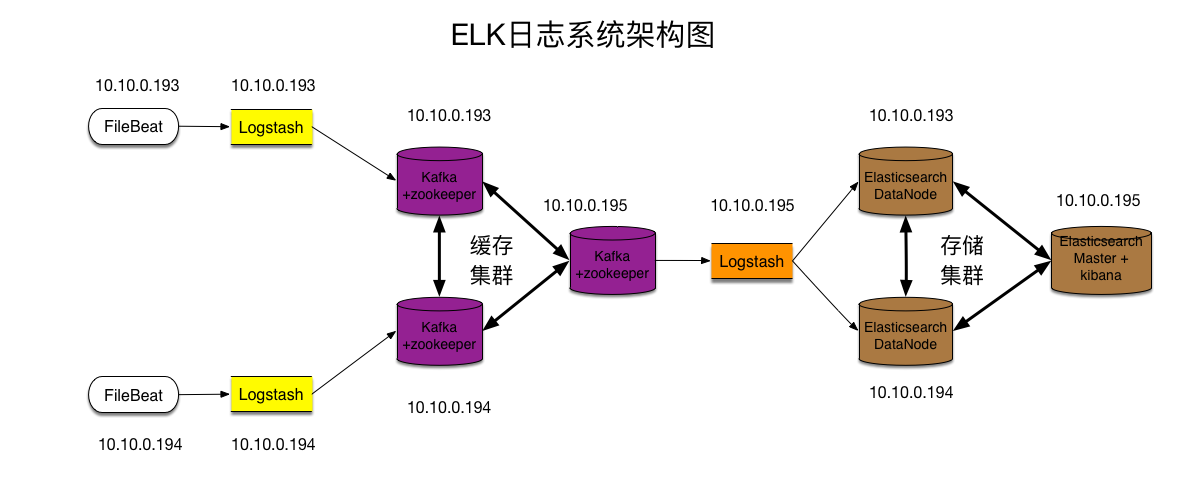
架构解读 : (整个架构从左到右,总共分为5层)
第一层、数据采集层
最左边的是业务服务器集群,上面安装了filebeat做日志采集,同时把采集的日志分别发送给两个logstash服务。
第二层、数据处理层,数据缓存层
logstash服务把接受到的日志经过格式处理,转存到本地的kafka broker+zookeeper 集群中。
第三层、数据转发层
这个单独的Logstash节点会实时去kafka broker集群拉数据,转发至ES DataNode。
第四层、数据持久化存储
ES DataNode 会把收到的数据,写磁盘,建索引库。
第五层、数据检索,数据展示
ES Master + Kibana 主要协调ES集群,处理数据检索请求,数据展示。
环境
操作系统环境 : CentOS 7.2
各服务器角色分配 :
3台服务器:
IP : 10.10.0.193
IP : 10.10.0.194
IP : 10.10.0.195
| IP | 角色 | 所属集群 |
|---|---|---|
| 10.10.0.193 10.10.0.194 | nginx+filebeat nginx+filebeat | 业务服务器集群 |
| 10.10.0.193 | Logstash+Kafka+ZooKeeper | 缓存集群 |
| 10.10.0.194 | Logstash+Kafka+ZooKeeper | |
| 10.10.0.195 | Kafka+ZooKeeper | |
| 10.10.0.195 | Logstash | 数据转发 |
| 10.10.0.193 | ES DataNode | Elasticsearch 集群 |
| 10.10.0.194 | ES DataNode | |
| 10.10.0.195 | ES Master+Kibana |
软件包版本和下载网站:
jdk-8u161-linux-x64.rpm
node-v8.10.0-linux-x64.tar.xz
nginx-1.12.2.tar.gz
logstash-6.2.2.tar.gz
filebeat-6.2.2-x86_64.rpm
kafka_2.11-1.0.1.tgz
zookeeper-3.4.10.tar.gz
elasticsearch-6.2.2.tar.gz
kibana-6.2.2-linux-x86_64.tar.gz
jdk下载:http://www.oracle.com/technetwork/java/javase/downloads/jdk8-downloads-2133151.html
nodejs下载:https://nodejs.org/en/download/
nginx下载:http://nginx.org/en/download.html
filebeat,logstash,elasticsearch,kibana下载:https://www.elastic.co/cn/downloads
kafka下载:http://kafka.apache.org/downloads
zookeeper下载:http://zookeeper.apache.org/releases.html#download
安装部署Elasticsearch集群
ES Master节点 10.10.0.195
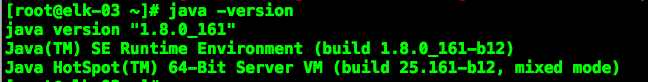
安装jdk1.8,elasticsearch
1 | 安装命令 |
验证jdk:
系统调优,JVM调优
1 | 配置系统最大打开文件描述符数 |
编写ES Master节点配置文件
1 | vim /opt/elasticsearch/config/elasticsearch.yml |
注: path.data、path.logs 这两个参数指定的路径,如果没有需要自己创建,还要赋予权限给es用户。(后面的ES DataNode也同样)
安装head开源插件
从es6.x后要自己手动编译安装
1 | 安装node |
访问,检测插件是否安装成功
这时,ES Master已经配置好了。
部署ES DataNode节点
ES DataNode节点 是10.10.0.193和10.10.0.194
安装和系统调优方法同上,插件不用安装,只是配置文件不同。
编写配置文件
1 | vim /opt/elasticsearch/config/elasticsearch.yml |
10.10.0.193 也准备好了,10.10.0.194和193配置一样,只需改下node.name
启动服务
1 | 10.10.0.195 |
访问head插件,查看集群状态
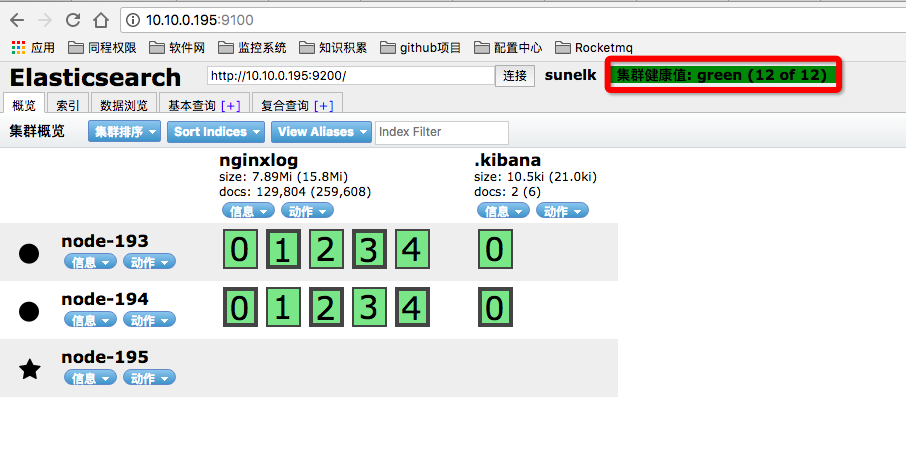 此时 Elasticsearch 集群已经准备完成
配置ZooKeeper集群
配置 10.10.0.193 节点
安装,配置 zookeeper
1 | zookeeper 依赖 java,如果之前没安装过JDK,则需要安装. |
编写配置文件
1 | vim /opt/zookeeper/conf/zoo.cfg |
同步配置文件到其他两台节点
注: zookeeper 集群,每个节点的配置文件都是一样的。所以直接同步过去,不需要做任何修改。
1 | scp zoo.cfg 10.10.0.193:/opt/zookeeper/conf/ |
创建myid文件
1 | 10.10.0.193 |
启动服务 & 查看节点状态
1 | 10.10.0.193 |
此时zookeeper集群配置完成
配置Kafka Broker集群
Kafka官网: http://kafka.apache.org/
配置 10.10.0.193 节点
安装,配置 kafka
1 | 解压程序 |
编写配置文件
1 | vim /opt/kafka/conf/server.properties |
同步配置文件到其他两台节点
1 | scp server.properties 10.10.0.194:/opt/kafka/config/ |
注: 其他两个节点的配置文件也基本相同,只有一个参数需要修改 broker.id 。 它用于唯一标识节点,所以绝对不能相同,不然会节点冲突。
配置主机名对应IP的解析
1 | vim /etc/hosts |
启动服务
1 | nohup /opt/kafka/bin/kafka-server-start.sh /opt/kafka/config/server.properties & |
Kafka+ZooKeeper集群配置完成
配置位于架构图中第二层的Logstash服务
配置 10.10.0.193节点
安装,配置 logstash
1 | 解压程序 |
编写配置文件
1 | vim /opt/logstash/config/logstash_in_kafka.conf |
启动服务
1 | nohup /opt/logstash/bin/logstash -f /opt/logstash/config/logstash_in_kafka.conf & |
10.10.0.194 节点的这块配置,与上述完全相同。(略)
位于第二层、数据处理层的 Logstash 配置完成
配置数据采集层,业务服务器+Filebeat
定制Nginx日志格式
1 | log_format json '{"@timestamp":"$time_iso8601",' |
安装 Filebeat
Filebeat 也是 Elasticsearch 公司的产品,在官网可以下载。
1 | rpm 包安装 |
编写 Filebeat 配置文件
1 | vim /etc/filebeat/filebeat.yml |
启动服务
1 | /etc/init.d/filebeat start |
数据采集层,Filebeat配置完成。
现在业务服务器上的日志数据已经在源源不断的写入缓存了。
配置位于架构图中的第三层,数据转发层
10.10.0.195 logstash 安装过程和193/194一样,参考上面步骤。
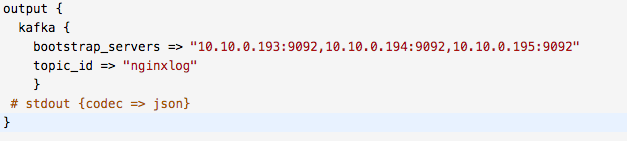
编写Logstash配置文件
1 | vim /opt/logstash/config/kafka_to_es.conf |
启动服务
1 | nohup /opt/logstash/bin/logstash -f /opt/logstash/config/kafka_to_es.conf & |
数据转发层已经配置完成
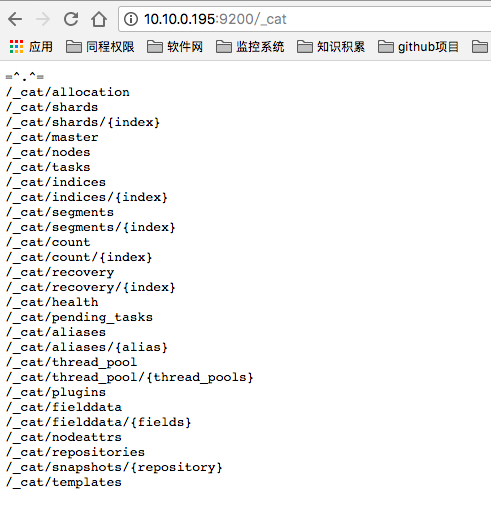
修改ES的索引模版配置
为什么要做这一步呢? 因为logstash写入数据到ES时,会自动选用一个索引模版。 我们可以看一下
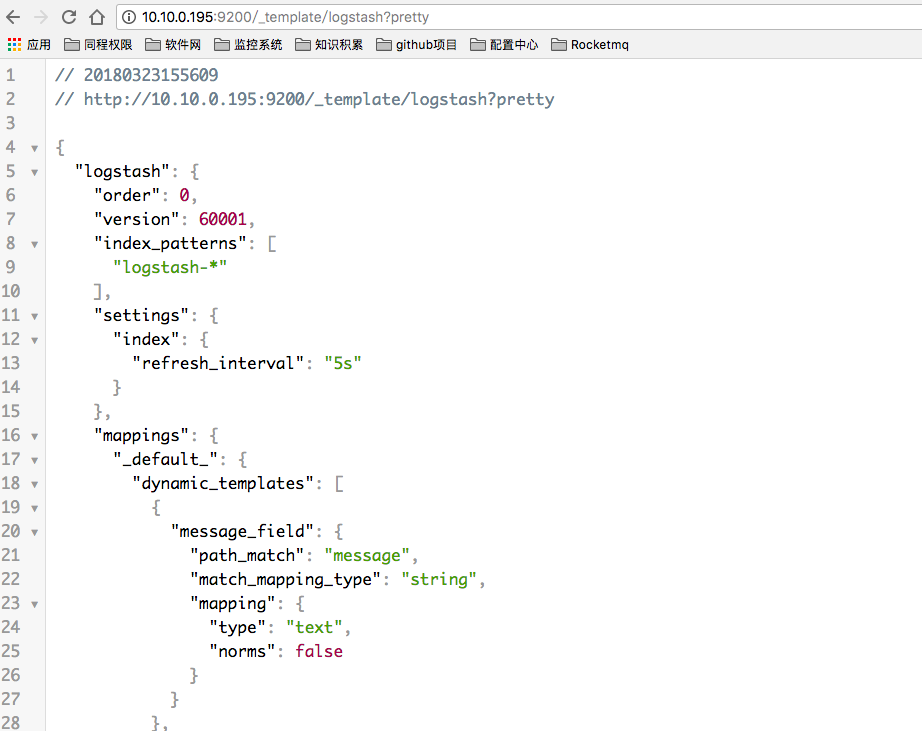
这个模版其实也挺好,不过有一个参数,我标记出来了。 “refresh_interval”:”5s” 这个参数用于控制,索引的刷新频率。 索引的刷新频率越快,你搜索到的数据就实时。 这里是5秒。 一般我们日志场景不需要这么高的实时性。 可以适当降低该参数,提高ES 索引库的写入速度。
上传自定义模版
1 | 查看模板列表 |
由于这个自定义模版,我把优先级 order 定义的比logstash模版高,而模版的匹配规则又一样,所以这个自定义模版的配置会覆盖原logstash模版。
我这里只是简单描述。 如果要详细理解其中道理,请查看我的 ES 调优篇。
配置 Kibana 数据展示层
10.10.0.195 节点
Kibana是ELK套件中的一员,也属于elasticsearch 公司,在官网提供下载。
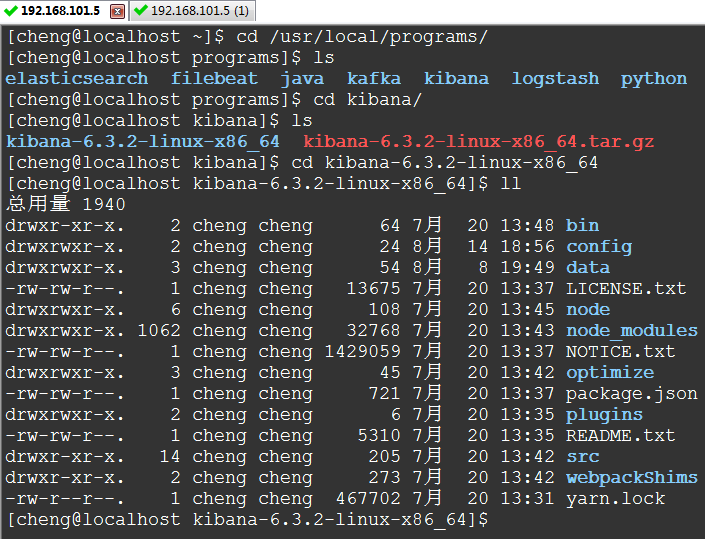
安装
1 | tar -xzvf kibana-6.2.2-linux-x86_64.tar.gz -C /opt/ |
修改配置文件
1 | vim /opt/kibana/config/kibana.yml |
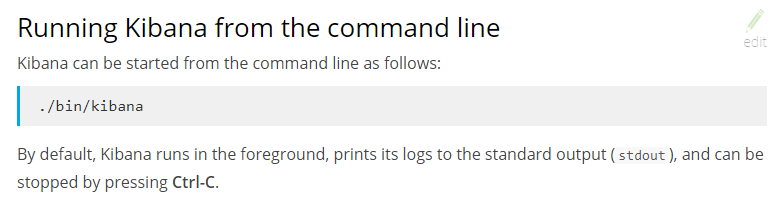
启动服务
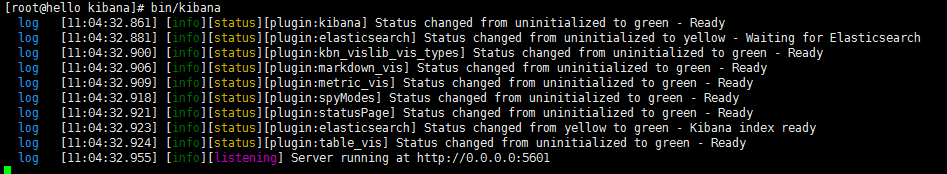
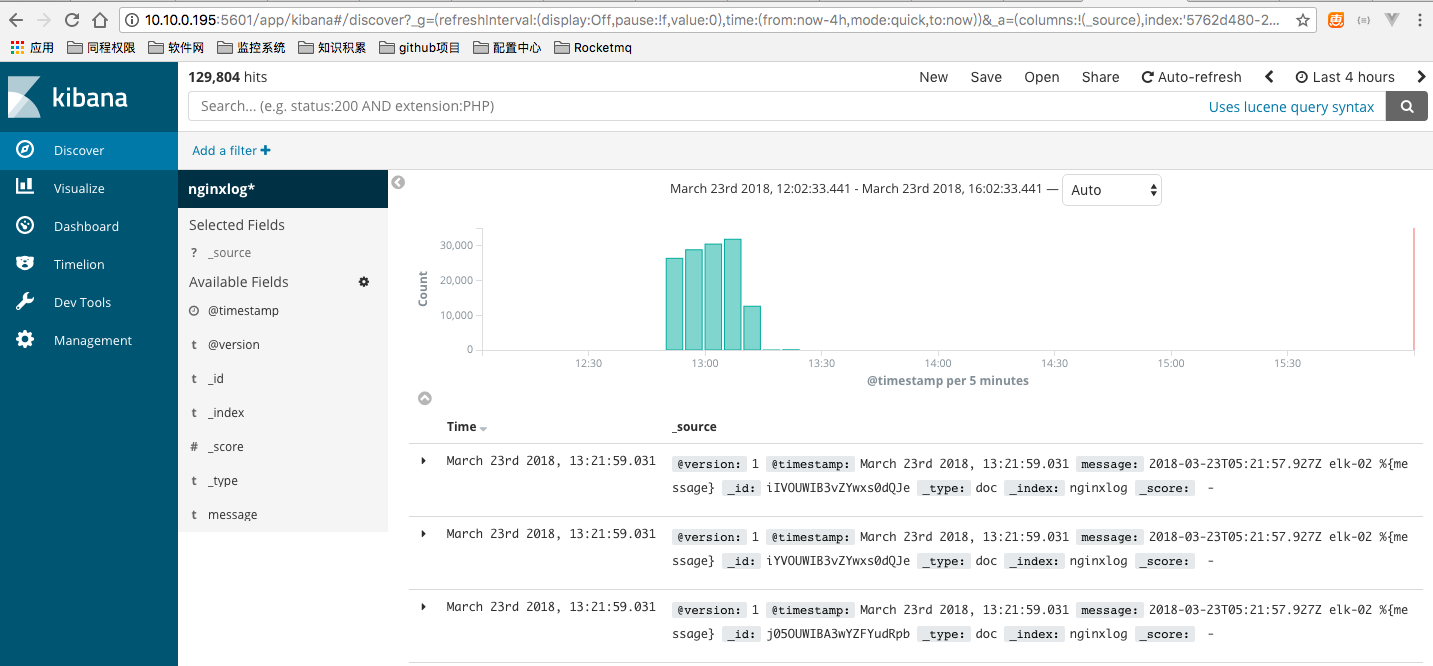
打开浏览器访问: http://10.10.0.195:5601/
kibana
Kibana是一个开源的分析和可视化平台,设计用于和Elasticsearch一起工作。
你用Kibana来搜索,查看,并和存储在Elasticsearch索引中的数据进行交互。
你可以轻松地执行高级数据分析,并且以各种图标、表格和地图的形式可视化数据。
Kibana使得理解大量数据变得很容易。它简单的、基于浏览器的界面使你能够快速创建和共享动态仪表板,实时显示Elasticsearch查询的变化。
安装Kibana
Kibana配置
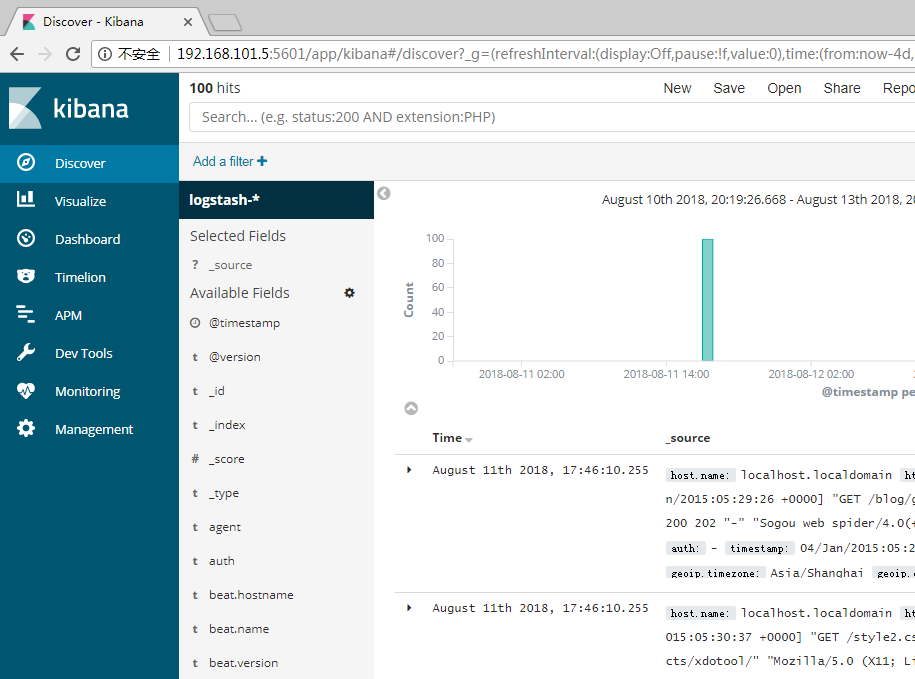
访问Kibana
Kibana是一个Web应用程序,你可以通过5601来访问它。例如:localhost:5601 或者 http://YOURDOMAIN.com:5601
当访问Kibana时,默认情况下,Discover页面加载时选择了默认索引模式。时间过滤器设置为最近15分钟,搜索查询设置为match-all(*)
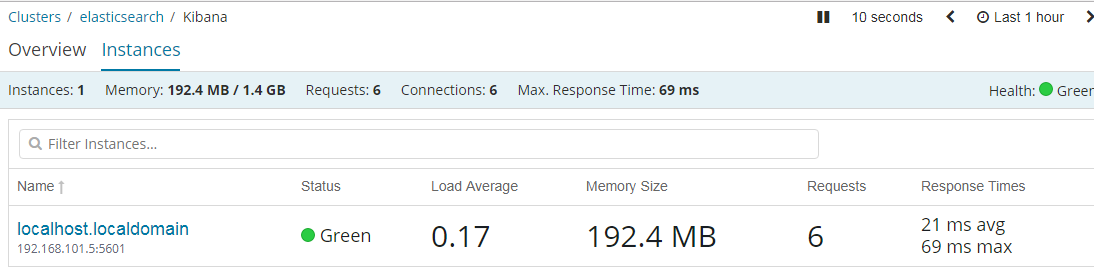
检查Kibana状态
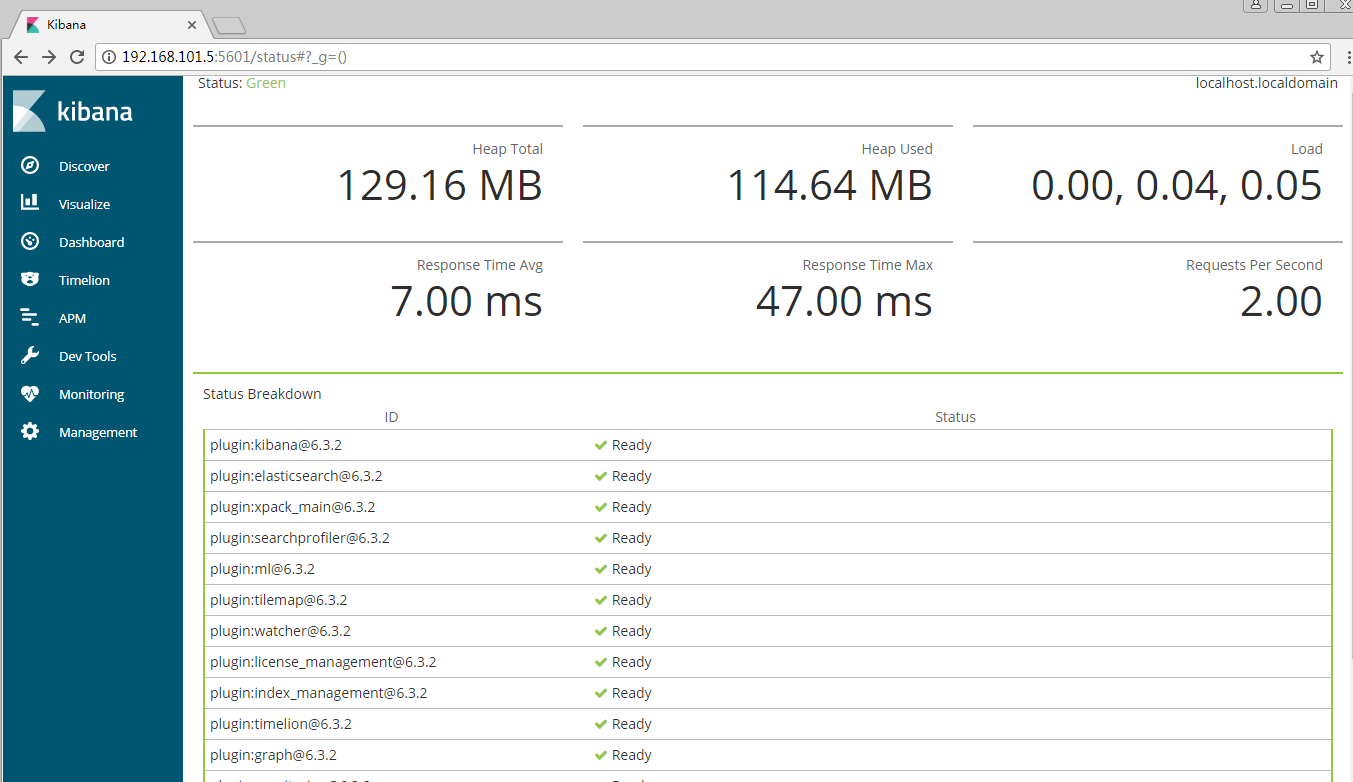
或者 http://192.168.101.5:5601/api/status 返回JSON格式状态信息
用Elasticsearch连接到Kibana
在你开始用Kibana之前,你需要告诉Kibana你想探索哪个Elasticsearch索引。第一次访问Kibana是,系统会提示你定义一个索引模式以匹配一个或多个索引的名字。
(提示:默认情况下,Kibana连接允许在localhost上的Elasticsearch实例。为了连接到一个不同的Elasticsearch实例,修改kabana.yml中Elasticsearch的URL,然后重启Kibana。)
为了配置你想要用Kibana访问的Elasticsearch索引:
1、访问Kibana UI。例如,localhost:56011 或者 http://YOURDOMAIN.com:5601
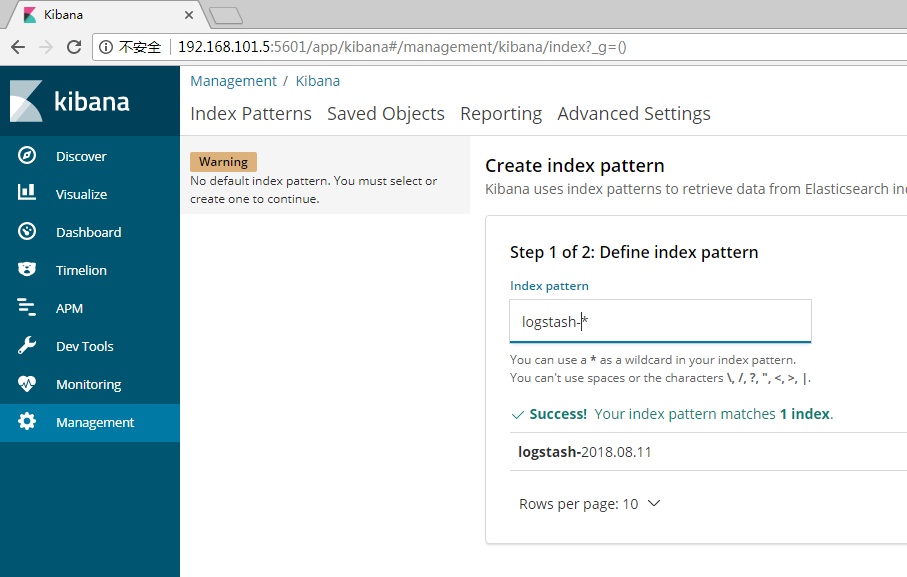
2、指定一个索引模式来匹配一个或多个你的Elasticsearch索引。当你指定了你的索引模式以后,任何匹配到的索引都将被展示出来。
(画外音:*匹配0个或多个字符; 指定索引默认是为了匹配索引,确切的说是匹配索引名字)
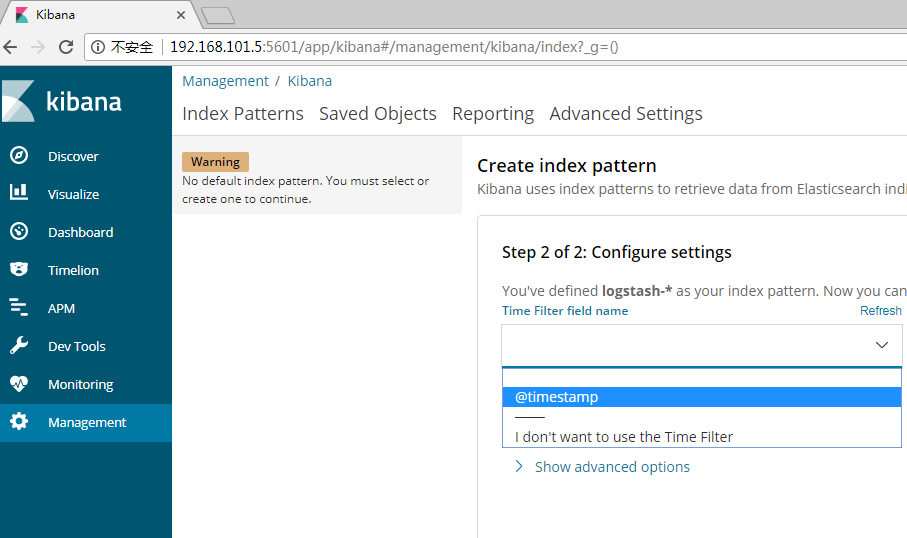
3、点击“Next Step”以选择你想要用来执行基于时间比较的包含timestamp字段的索引。如果你的索引没有基于时间的数据,那么选择“I don’t want to use the Time Filter”选项。
4、点击“Create index pattern”按钮来添加索引模式。第一个索引模式自动配置为默认的索引默认,以后当你有多个索引模式的时候,你就可以选择将哪一个设为默认。(提示:Management > Index Patterns)
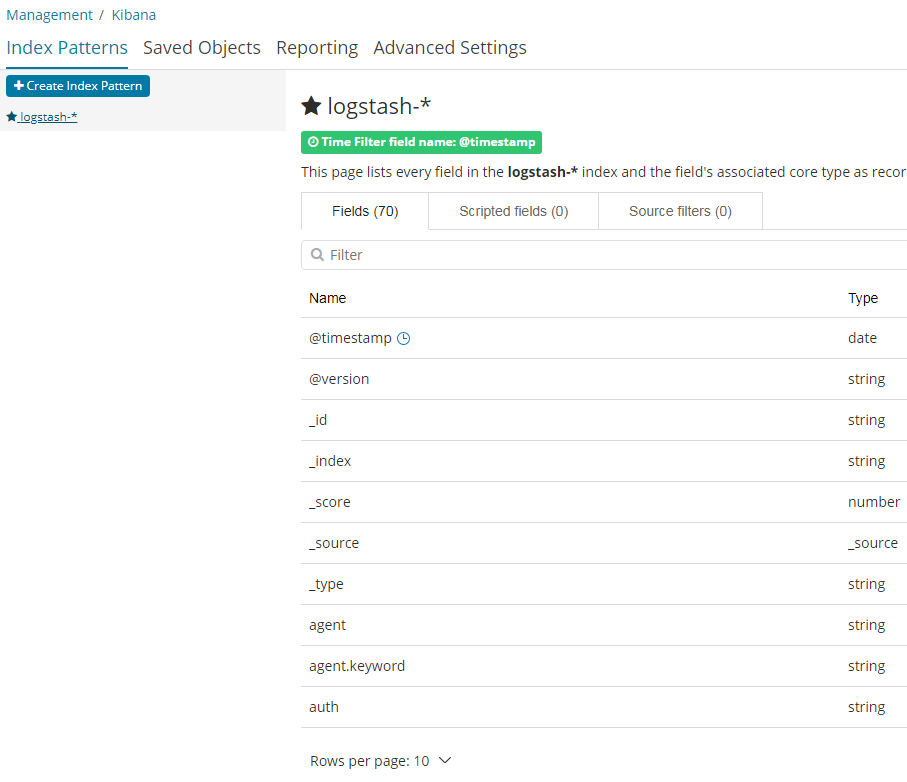
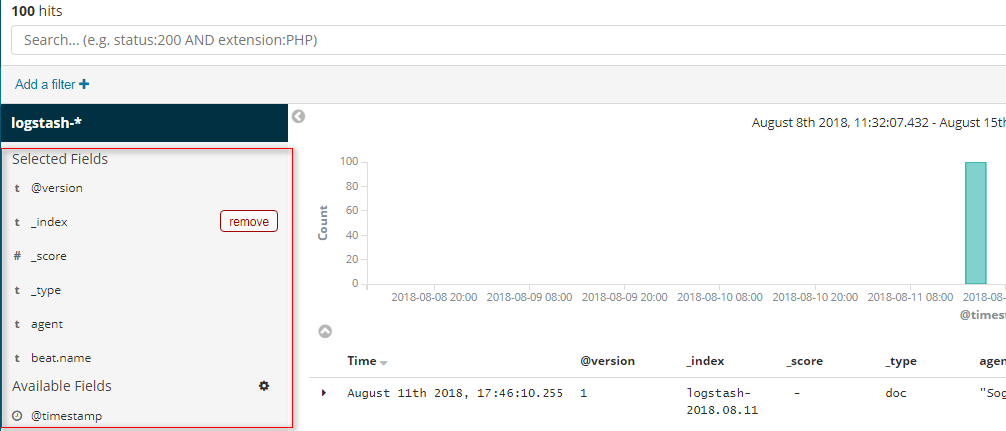
现在,Kibana已经连接到你的Elasticsearch数据。Kibana展示了一个只读的字段列表,这些字段是匹配到的这个索引配置的字段。
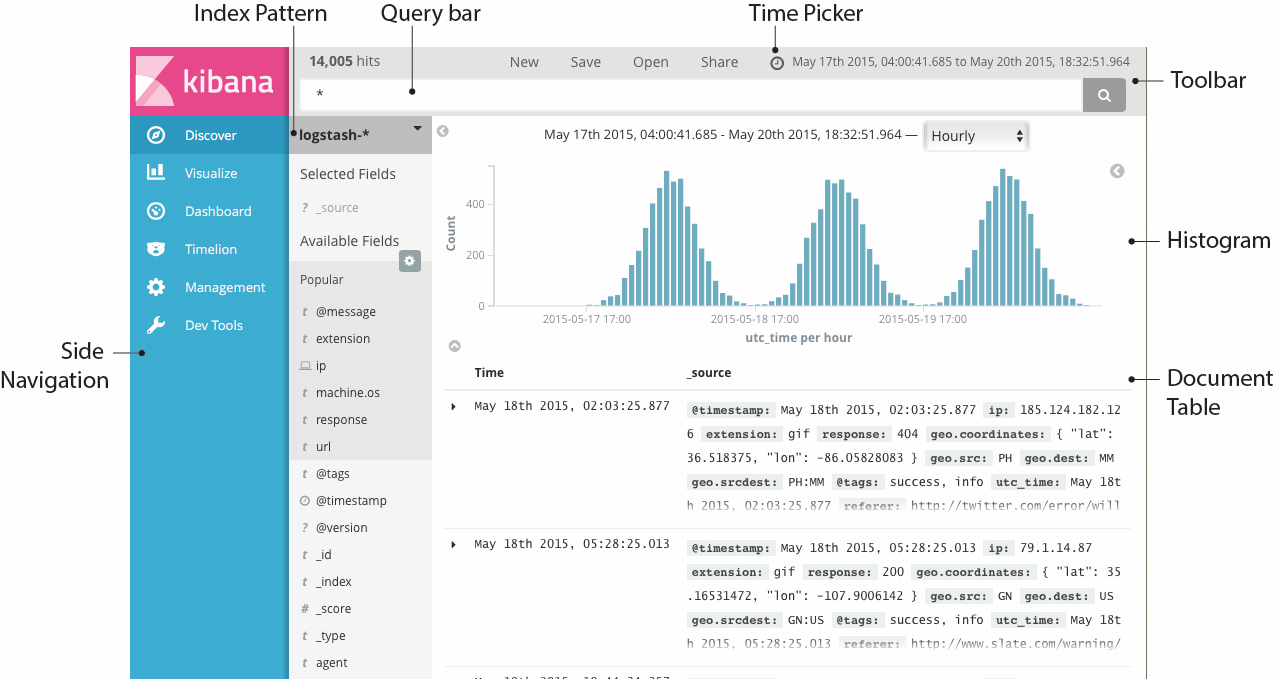
使用说明之Discover
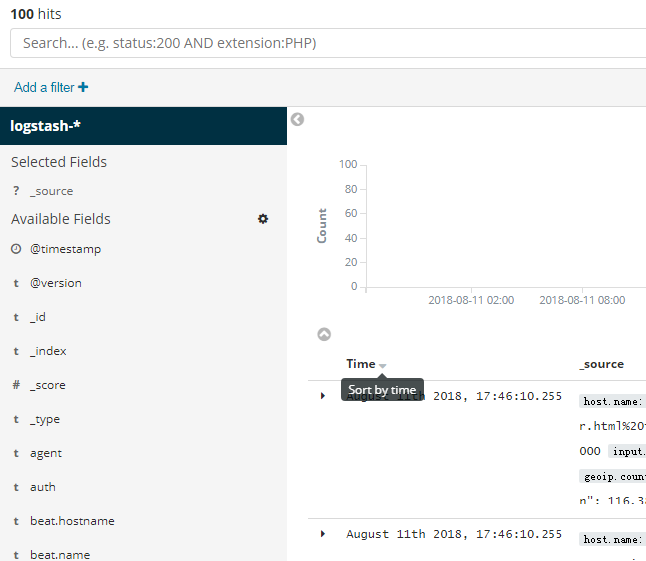
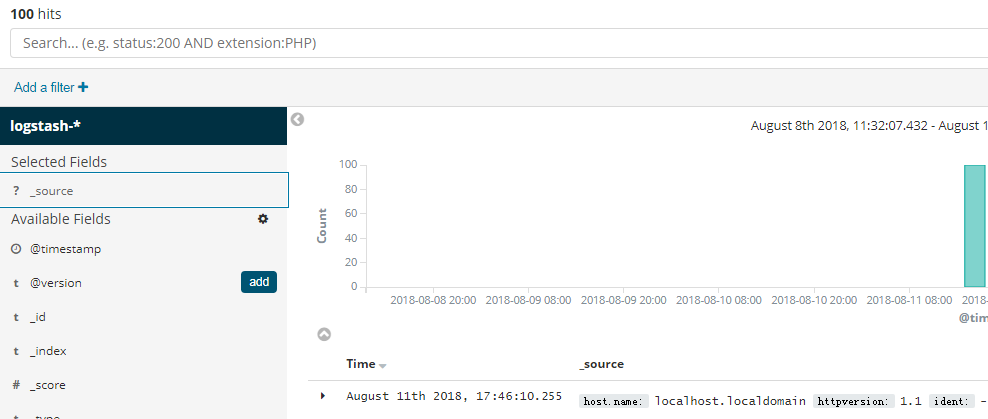
你可以从Discover页面交互式的探索你的数据。你可以访问与所选择的索引默认匹配的每个索引中的每个文档。你可以提交查询请求,过滤搜索结构,并查看文档数据。你也可以看到匹配查询请求的文档数量,以及字段值统计信息。如果你选择的索引模式配置了time字段,则文档随时间的分布将显示在页面顶部的直方图中。
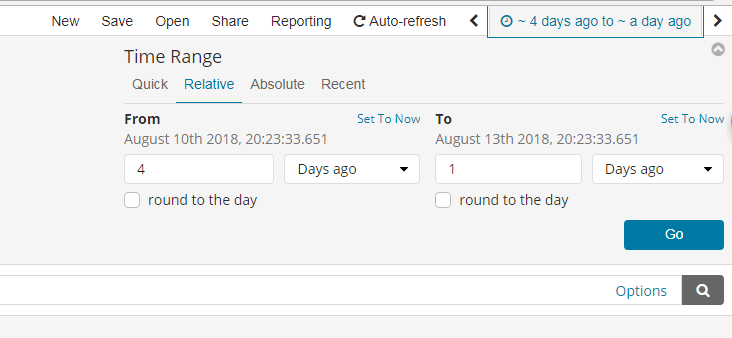
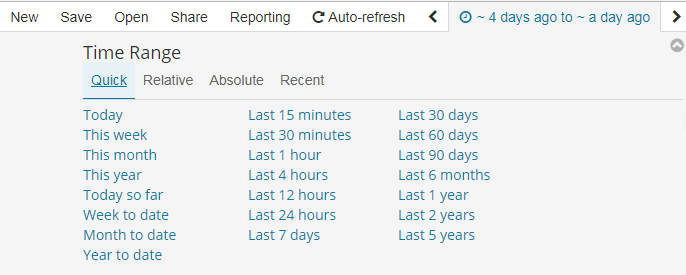
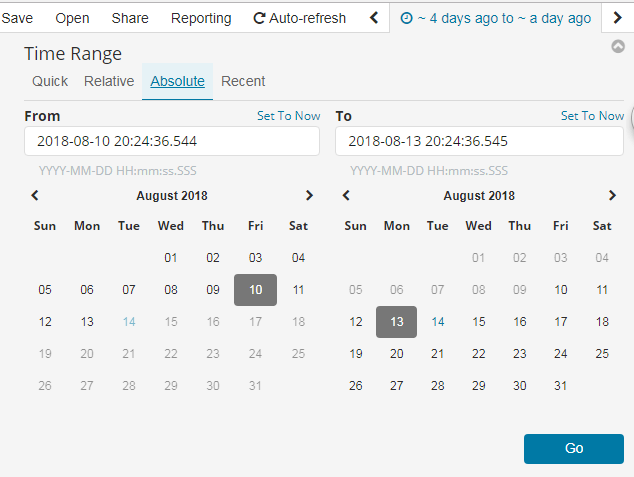
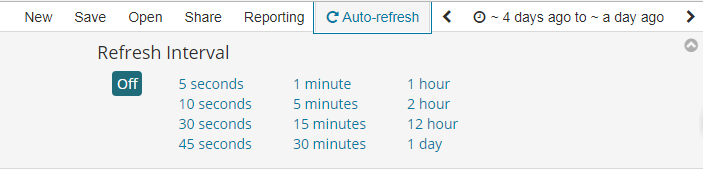
设置时间过滤
搜索数据
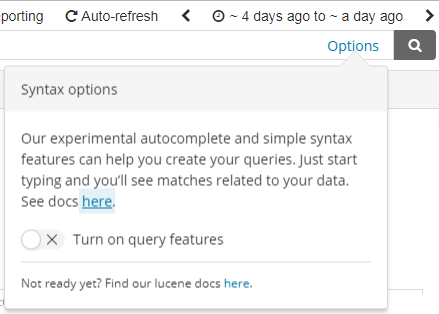
你可以在搜索框中输入查询条件来查询当前索引模式匹配的索引。在查询的时候,你可以使用Kibana标准的查询语言(基于Lucene的查询语法)或者完全基于JSON的Elasticsearch查询语言DSL。Kibana查询语言可以使用自动完成和简化的查询语法作为实验特性,您可以在查询栏的“选项”菜单下进行选择。
当你提交一个查询请求时,直方图、文档表和字段列表都会更新,以反映搜索结果。命中(匹配到的文档)总数会显示在工具栏中。文档表格中显示了前500个命中。默认情况下,按时间倒序排列,首先显示最新的文档。你可以通过点击“Time”列来逆转排序顺序。
Lucene查询语法
Kibana查询语言基于Lucene查询语法。下面是一些提示,可能会帮到你:
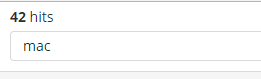
- 为了执行一个文本搜索,可以简单的输入一个文本字符串。例如,如果你想搜索web服务器的日志,你可以输入关键字”safari“,这样你就可以搜索到所有有关”safari”的字段
- 为了搜索一个特定字段的特定值,可以用字段的名称作为前缀。例如,你输入”status:200“,将会找到所有status字段的值是200的文档
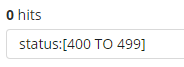
- 为了搜索一个范围值,你可以用括号范围语法,[START_VALUE TO END_VALUE]。例如,为了找到状态码是4xx的文档,你可以输入status:[400 TO 499]
- 为了指定更改复杂的查询条件,你可以用布尔操作符 AND , OR , 和 NOT。例如,为了找到状态码是4xx并且extension字段是php或者html的文档,你可以输入status:[400 TO 499] AND (extension:php OR extension:html)
Kibana查询语法增强
新的更简单的语法
如果你熟悉Kibana的旧Lucene查询语法,那么你应该对这种新的语法也不会陌生。基本原理保持不变,我们只是简单地改进了一些东西,使查询语言更易于使用。
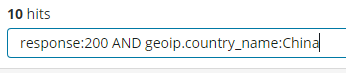
response:200 将匹配response字段的值是200的文档
用引号引起来的一段字符串叫短语搜索。例如,message:”Quick brown fox” 将在message字段中搜索”quick brown fox”这个短语。如果没有引号,将会匹配到包含这些词的所有文档,而不管它们的顺序如何。这就意味着,会匹配到”Quick brown fox”,而不会匹配”quick fox brown”。(画外音:引号引起来作为一个整体)
查询解析器将不再基于空格进行分割。多个搜索项必须由明确的布尔运算符分隔。注意,布尔运算符不区分大小写。
在Lucene中,response:200 extension:php 等价于 response:200 and extension:php。这将匹配response字段值匹配200并且extenion字段值匹配php的文档。
如果我们把中间换成or,那么response:200 or extension:php将匹配response字段匹配200 或者 extension字段匹配php的文档。
默认情况下,and 比 or 具有更高优先级。
response:200 and extension:php or extension:css 将匹配response是200并且extension是php,或者匹配extension是css而response任意
括号可以改变这种优先级
response:200 and (extension:php or extension:css) 将匹配response是200并且extension是php或者css的文档
还有一种简写的方式:
response:(200 or 404) 将匹配response字段是200或404的文档。字符值也可以是多个,比如:tags:(success and info and security)
还可以用not
not response:200 将匹配response不是200的文档
response:200 and not (extension:php or extension:css) 将匹配response是200并且extension不是php也不是css的文档
范围检索和Lucene有一点点不同
代替 byte:>1000,我们用byte > 1000
>, >=, <, <= 都是有效的操作符
response:* 将匹配所有存在response字段的文档
通配符查询也是可以的。machine.os:win* 将匹配machine.os字段以win开头的文档,像”windows 7”和”windows 10”这样的值都会被匹配到。
通配符也允许我们一次搜索多个字段,例如,假设我们有machine.os和machine.os.keyword两个字段,我们想要搜索这两个字段都有”windows 10”,那么我们可以这样写”machine.os*:windows 10”
刷新搜索结果
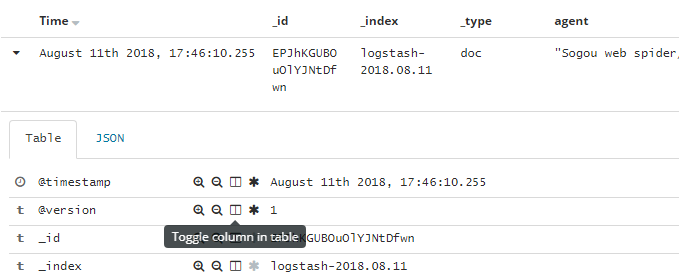
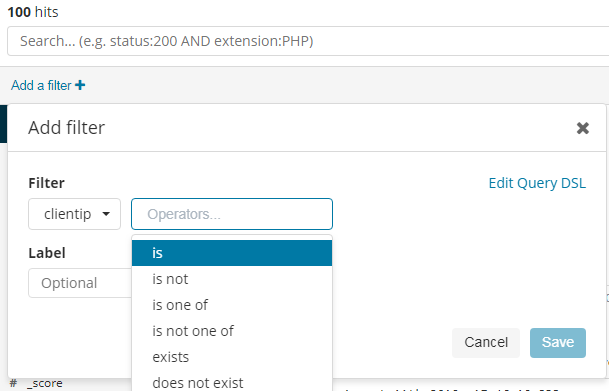
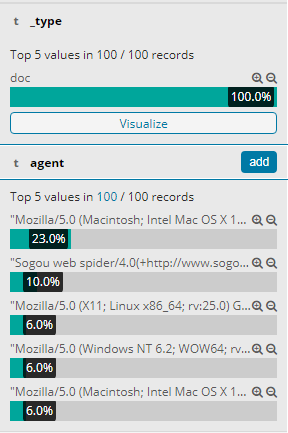
按字段过滤
以上是控制列表显示哪些字段,还有一种方式是在查看文档数据的时候点那个像书一样的小图标
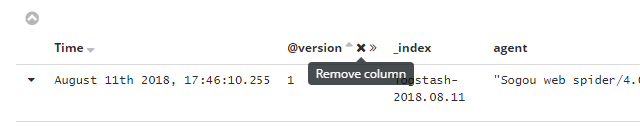
删除也是可以的
我们还可以编辑一个DSL查询语句,用于过滤筛选,例如
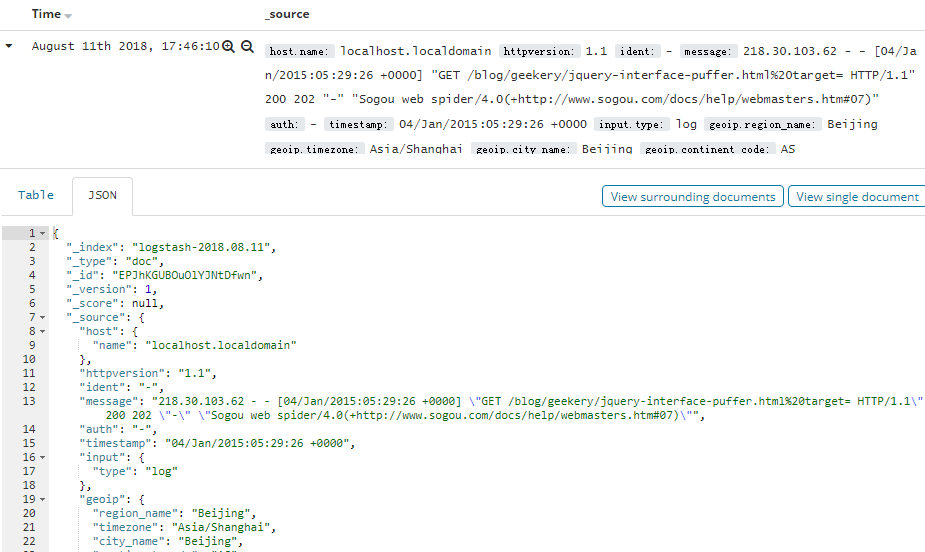
查看文档数据
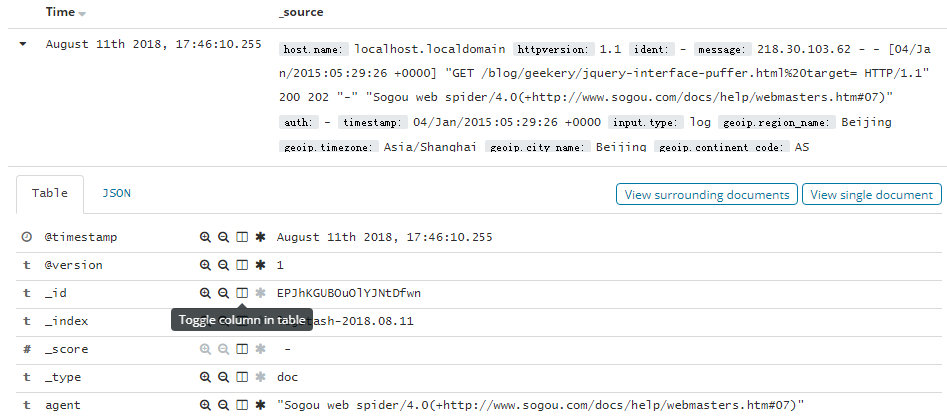
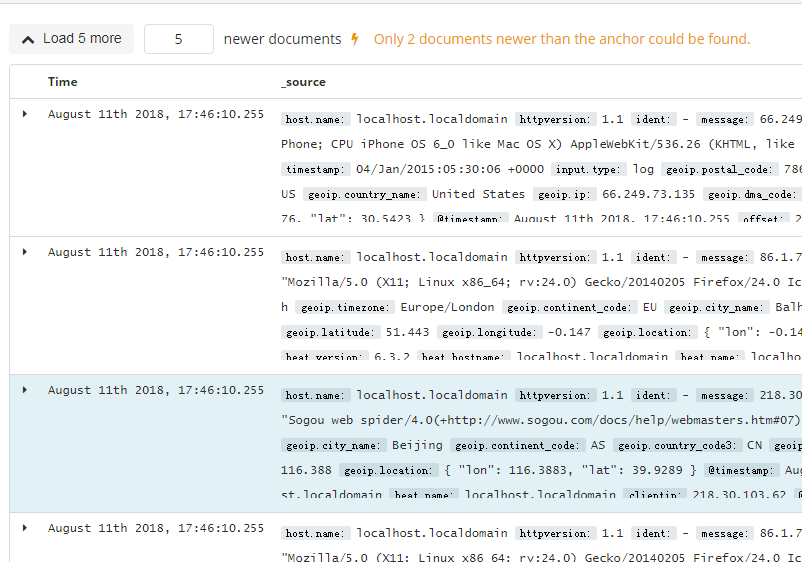
查看文档上下文

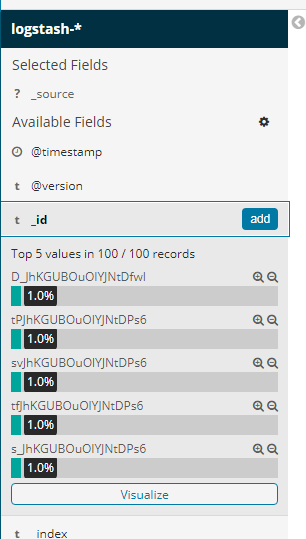
查看字段数据统计
 )
)
使用说明之Visualize
Visualize使得你可以创建在你的Elasticsearch索引中的数据的可视化效果。然后,你可以构建dashboard来展示相关可视化。
Kibana可视化是基于Elasticsearch查询的。通过用一系列的Elasticsearch聚集来提取并处理你的数据,你可以创建图片来线上你需要了解的趋势、峰值和低点。
创建一个可视化
为了创建一个可视化的视图:
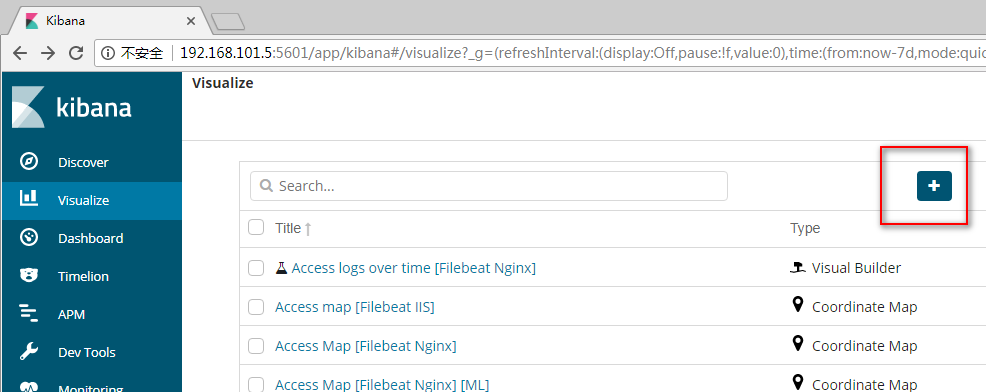
第1步:点击左侧导航条中的“Visualize”按钮
第2步:点击“Create new visualization”按钮或者加号(+)按钮
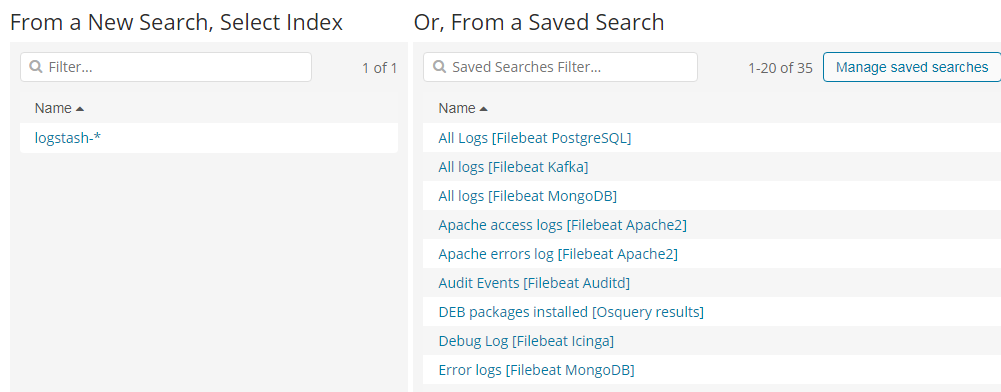
第3步:选择一个可视化类型
第4步:指定一个搜索查询来检索可视化数据
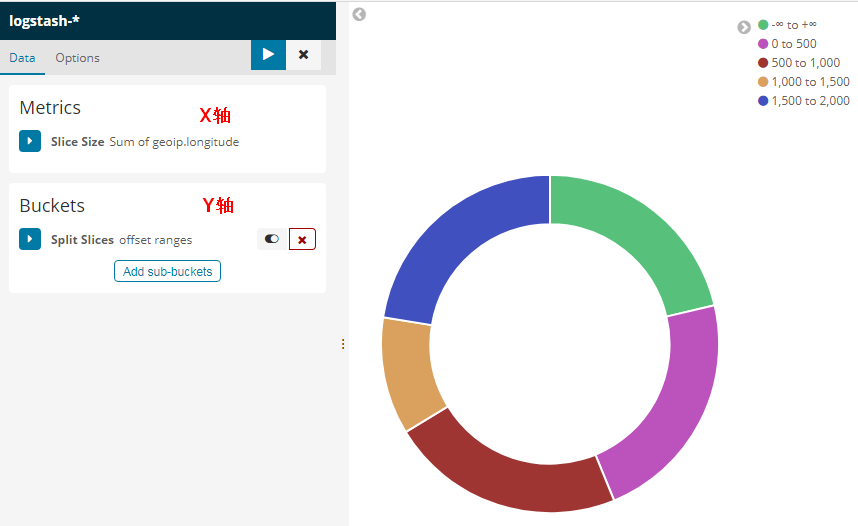
第5步:在可视化的构建器中选择Y轴的聚合操作。例如,sum,average,count等等
第6步:设置X轴
例如:

更多请看这里
https://www.elastic.co/guide/en/kibana/current/createvis.html
https://www.elastic.co/guide/en/kibana/current/xy-chart.html
https://www.elastic.co/guide/en/kibana/current/visualize.html
使用说明之Dashboard
Kibana仪表板显示可视化和搜索的集合。你可以安排、调整和编辑仪表板内容,然后保存仪表板以便共享它。
构建一个Dashboard
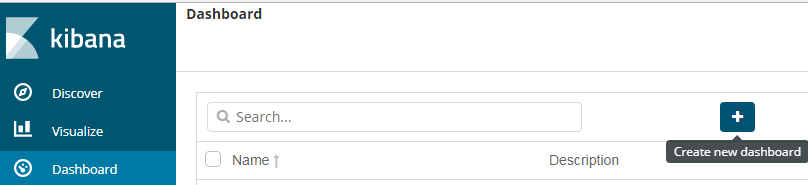
第1步:在导航条上点击“Dashboard”
第2步:点击“Create new dashboard”或者“加号(+)”按钮
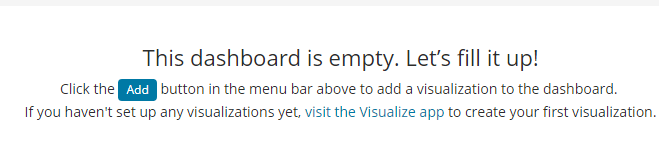
第3步:点击“Add”按钮
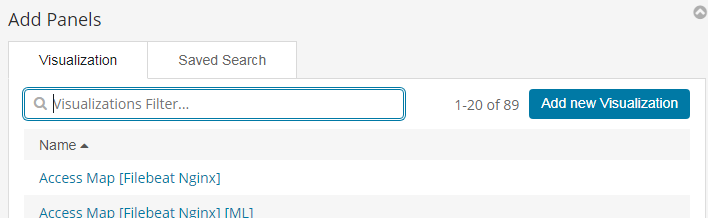
第4步:为了添加一个可视化,从可视化列表中选择一个,或者点击“Add new visualization”按钮新创建一个
第5步:为了添加一个已保存的查询,点击“Saved Search”选项卡,然后从列表中选择一个
第6步:当你完成添加并且调整了dashboard的内容后,去顶部菜单栏,点击“Save”,然后输入一个名字。
默认情况下,Kibana仪表板使用浅色主题。要使用深色主题,单击“选项”并选择“使用深色主题”。要将dark主题设置为默认,请转到管理>Management > Advanced ,并将dashboard:defaultDarkTheme设置为On。
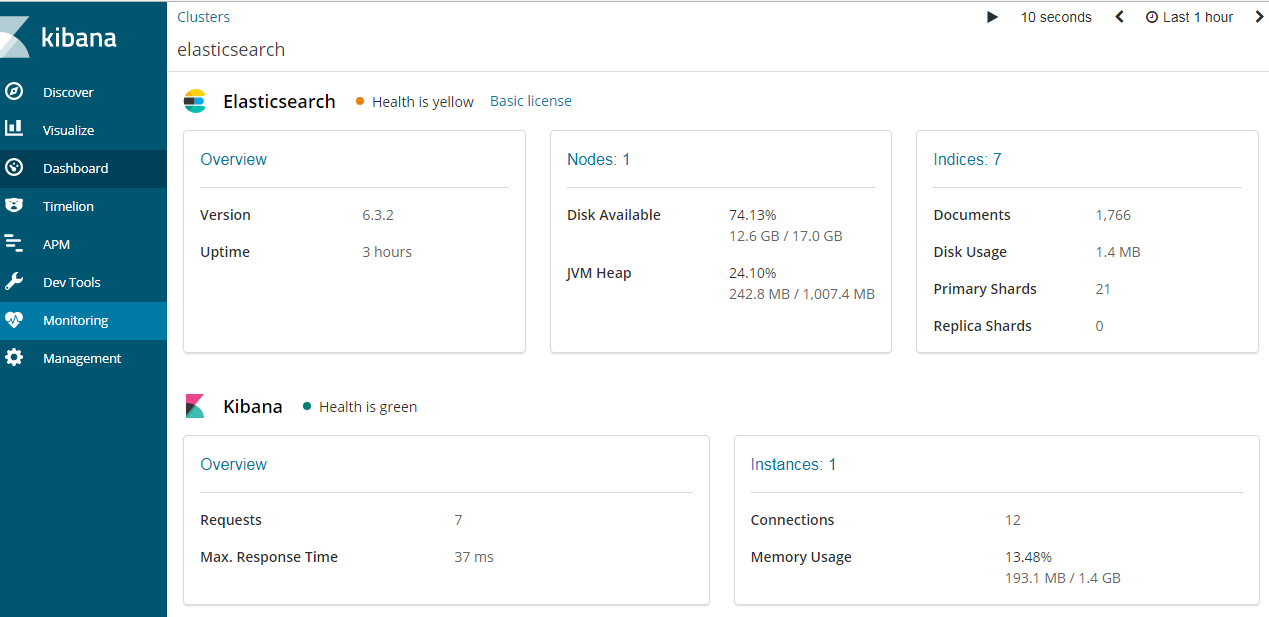
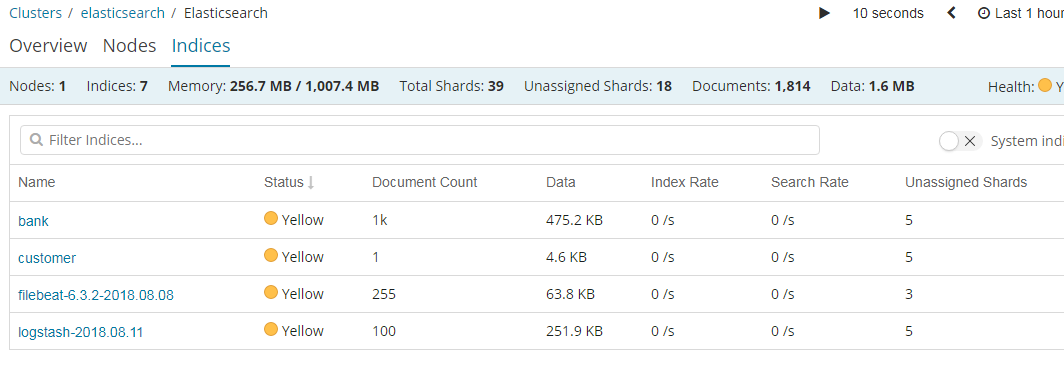
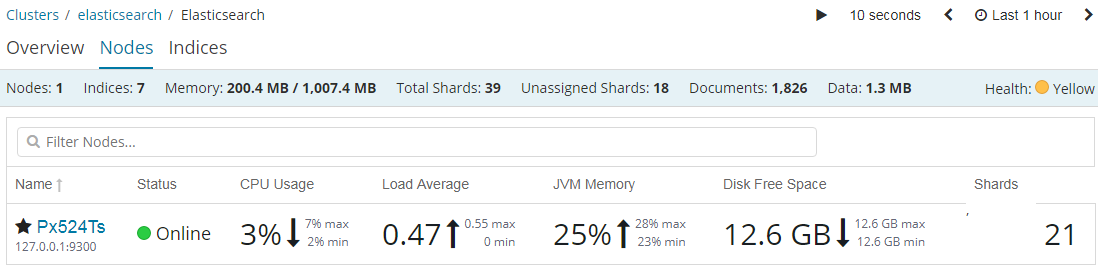
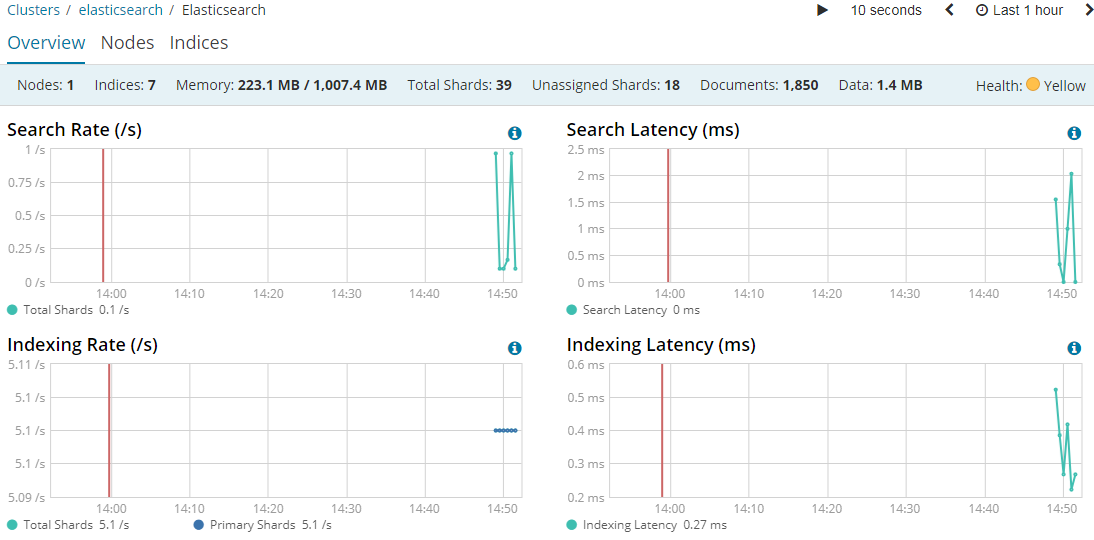
使用说明之Monitoring
1 | Elasticsearch控制台打印日志 |
https://www.elastic.co/guide/en/kibana/current/elasticsearch-metrics.html
数据展示
经验心得
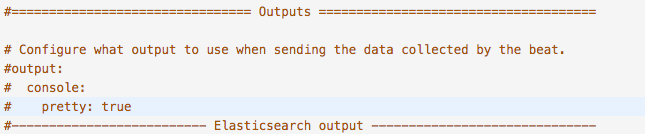
验证filebeat是否取得数据
把配置中,output配置打开,根据启动日志,看是否有数据进入
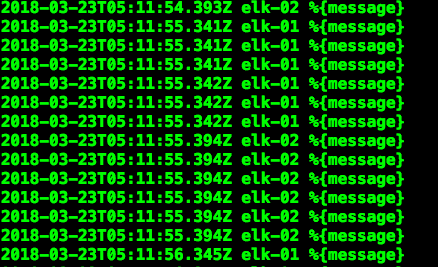
验证logstash是否取得数据
把配置中,output 中stdout注释打开,并暂时把kafka或es注释掉,重启logstash,根据启动日志,看是否有数据进入
验证kafka是否取得数据
1 | 查看kafka topic列表 |
验证es是否有数据存入数据
通过web页面或命令查看集群状态:
1 | 常用命令 |